Dashboard#
The dashboard (@@dashboard) turns the collected submissions into an
at-a-glance picture: charts and summary insights for the survey’s data.
Where the results view (@@results) is the working table of individual
submissions, the dashboard is the overview — how many answers, how they
distribute, and what the data looks like at a glance.
How to get here#
From the survey landing page, click Dashboard.
Directly at
/my-survey/@@dashboard.The dashboard feature must be enabled globally (default: on) and the survey needs stored results (the
storeaction) — with no data, the page shows the “No results yet” empty state.
What you see#
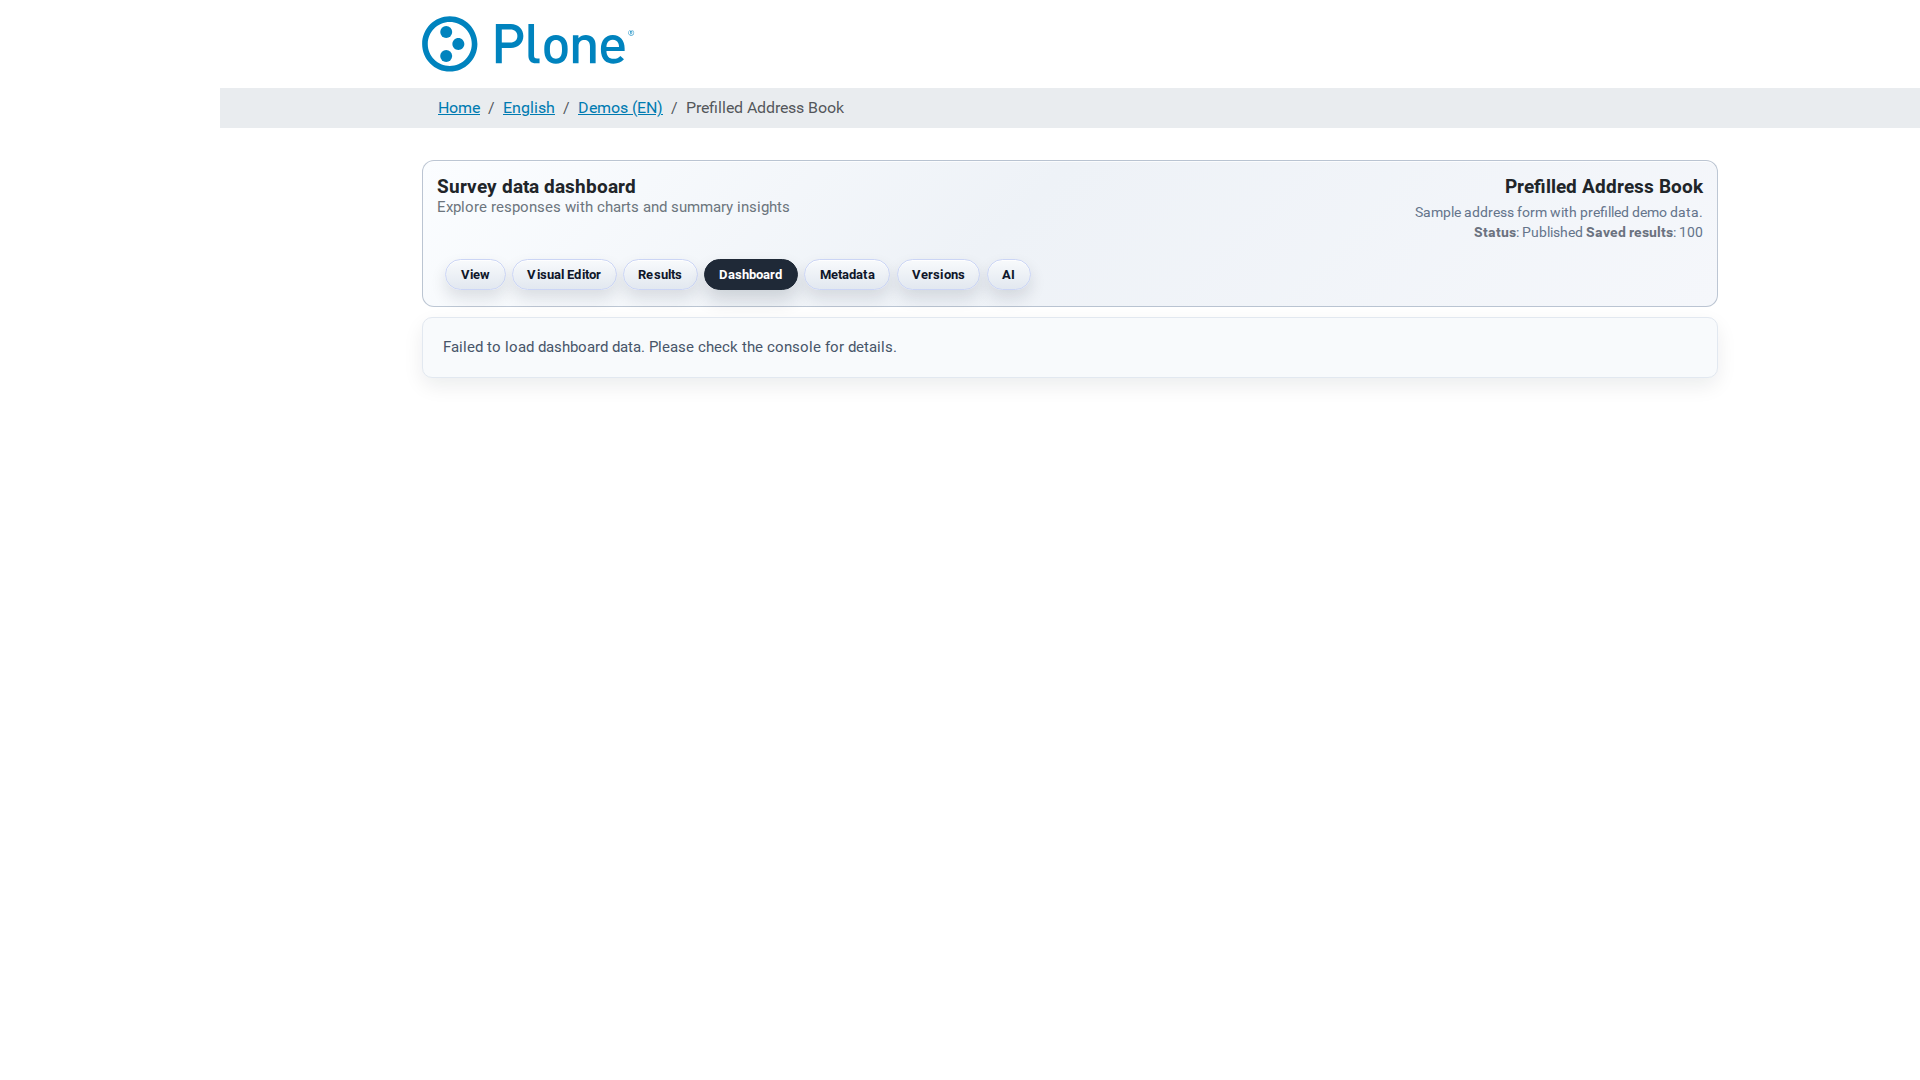
Survey header — the shared navigation with the headline “Survey data dashboard — Explore responses with charts and summary insights.”
The dashboard area — SurveyJS Analytics-based charts for the submissions: response counts and distributions per question, built dynamically from the collected data. The exact chart set depends on the question types used in the form (single choice → distribution, numeric → ranges, and so on).
Empty state — before the first submission, a friendly “No results yet” card explains that the survey has not received any responses yet.
What you can do#
Monitor collection progress — see at a glance how many answers arrived and how they distribute.
Spot trends and outliers — the charts make skewed answers, dominant choices or unexpected patterns visible immediately.
Drill down — when you need the individual records behind a number, switch to Results (
@@results) for the searchable table and the detail views.
Tips & notes#
The dashboard reads the stored submissions — it only shows data that the
storeaction persisted. Surveys withoutstorehave nothing to chart.The dashboard is a read-only overview; deleting or exporting data happens in the results view.
Like the Creator, the Dashboard component is a licensed SurveyJS component — the license notice appears until a key is configured under Site Setup > Forms (see Global options).
For a site-wide view across all surveys (submission rates, usage graphs), managers use the Submission Monitor (
@@survey-monitor) — see Results and Exports.